Features and Elements of a Dashboard That All Business Owners Need to Know
Business intelligence, data analytics, and dashboards are now essential tools for companies looking to improve their performance and increase profit. With all the data you need to collect, track and analyze in the current digital world, you might be wondering whether you’re getting the most value from your data. The first step in getting the most value from your data is to locate the most up-to-date dashboard program that includes the essential features that your company requires.
The dashboard is software for managing information that tracks the flow of data collected and presents business information in dynamic and customizable visualizations that allow users to track the health of a company process analyze processes in order to provide useful information. Let’s review some of the most important dashboard design features and elements you need to know about.
Features and Elements of a Dashboard That All Business Owners Need to Know
Below are some must-have features for your dashboard tool:
- Real-Time Updates:
Real-time technology is the latest trend in the present. Why is that it shouldn’t be? Consider that your data is updated automatically without the time-consuming and often error-prone task of manually entering the latest data. A real-time dashboard lets you track activity through all of your processes. Your reports and charts are constantly updated within less than one second after the event. No longer are you faced with the decision-maker requesting the information at an appointment that is changed, forcing the report author to complete the job twice. Whatever time you have to review the report, the data are current.
- Charts
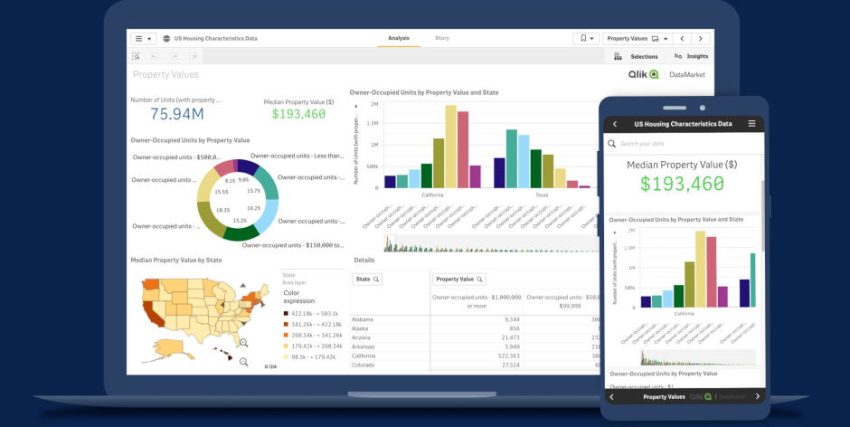
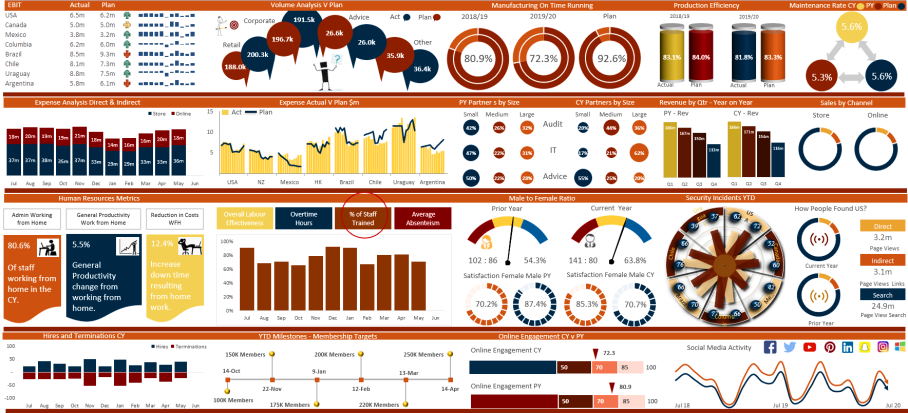
Dashboards display information in a variety of different ways. The eye-catching charts and colorful charts aid in communicating important metrics swiftly and visually. The data that is converted in a graphic chart graph is quicker and simpler to understand. This helps users comprehend complicated dashboard data, which can enhance the performance of your business. For instance, you can use a bar chart to provide specific information about numbers and numbers that affect those metrics that you consider vanity.
- Global Filters
Dashboards display several charts and graphs on one page most of the time. This allows you to track your most critical KPIs from one central hub. For instance, let’s say you need to alter dates, monitor your department’s performance, monitor the progress of a certain department, or follow the development of a recently delivered shipment. Filtering every chart and visual could be time-consuming.
A good BI software integrates globally-based dashboard filtering into the design. With only a few clicks, you’ll be able to adjust the information displayed on your dashboard. Even better, you can frequently save your custom filters so that you or other users can quickly snap to a saved metric at any point.
- Access 24/7
Analytics and data from your data will be available any time of the day on any device. Businesses can access the majority of dashboards that are cloud-based from smartphones, computers, or tablets. Specific dashboards might not have mobile access, but many consider this option if it is made an accepted industry norm.